Kegg Animate Pathway Save
Command-line utility to color objects of a KEGG pathway with arbitrary colors
kegg-animate-pathway
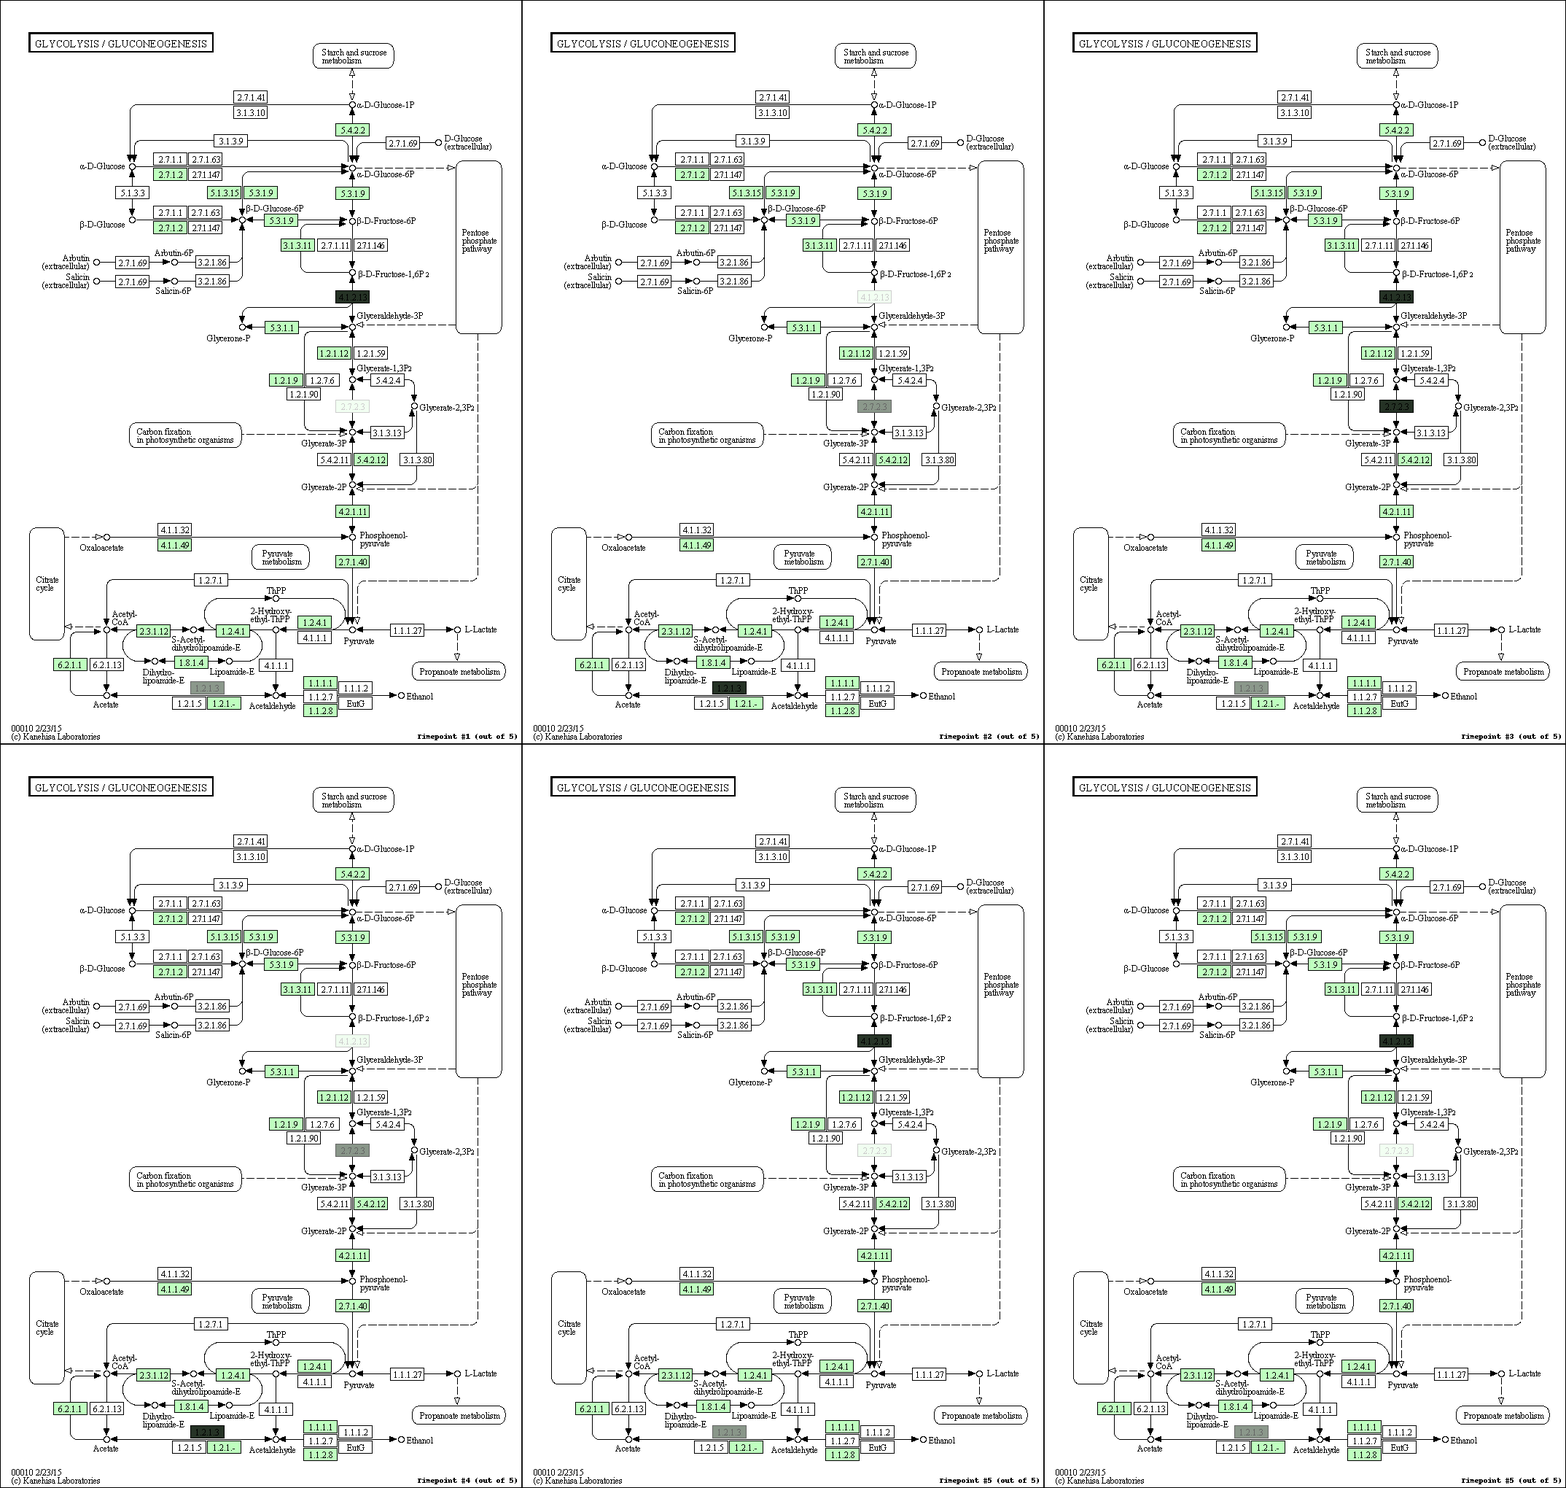
kegg-animate-pathway is a Python-based command-line utility which interfaces with the KEGG API to produce animated figures of metabolic pathways to reveal activities of its genes and/or compounds.
Here is an example:

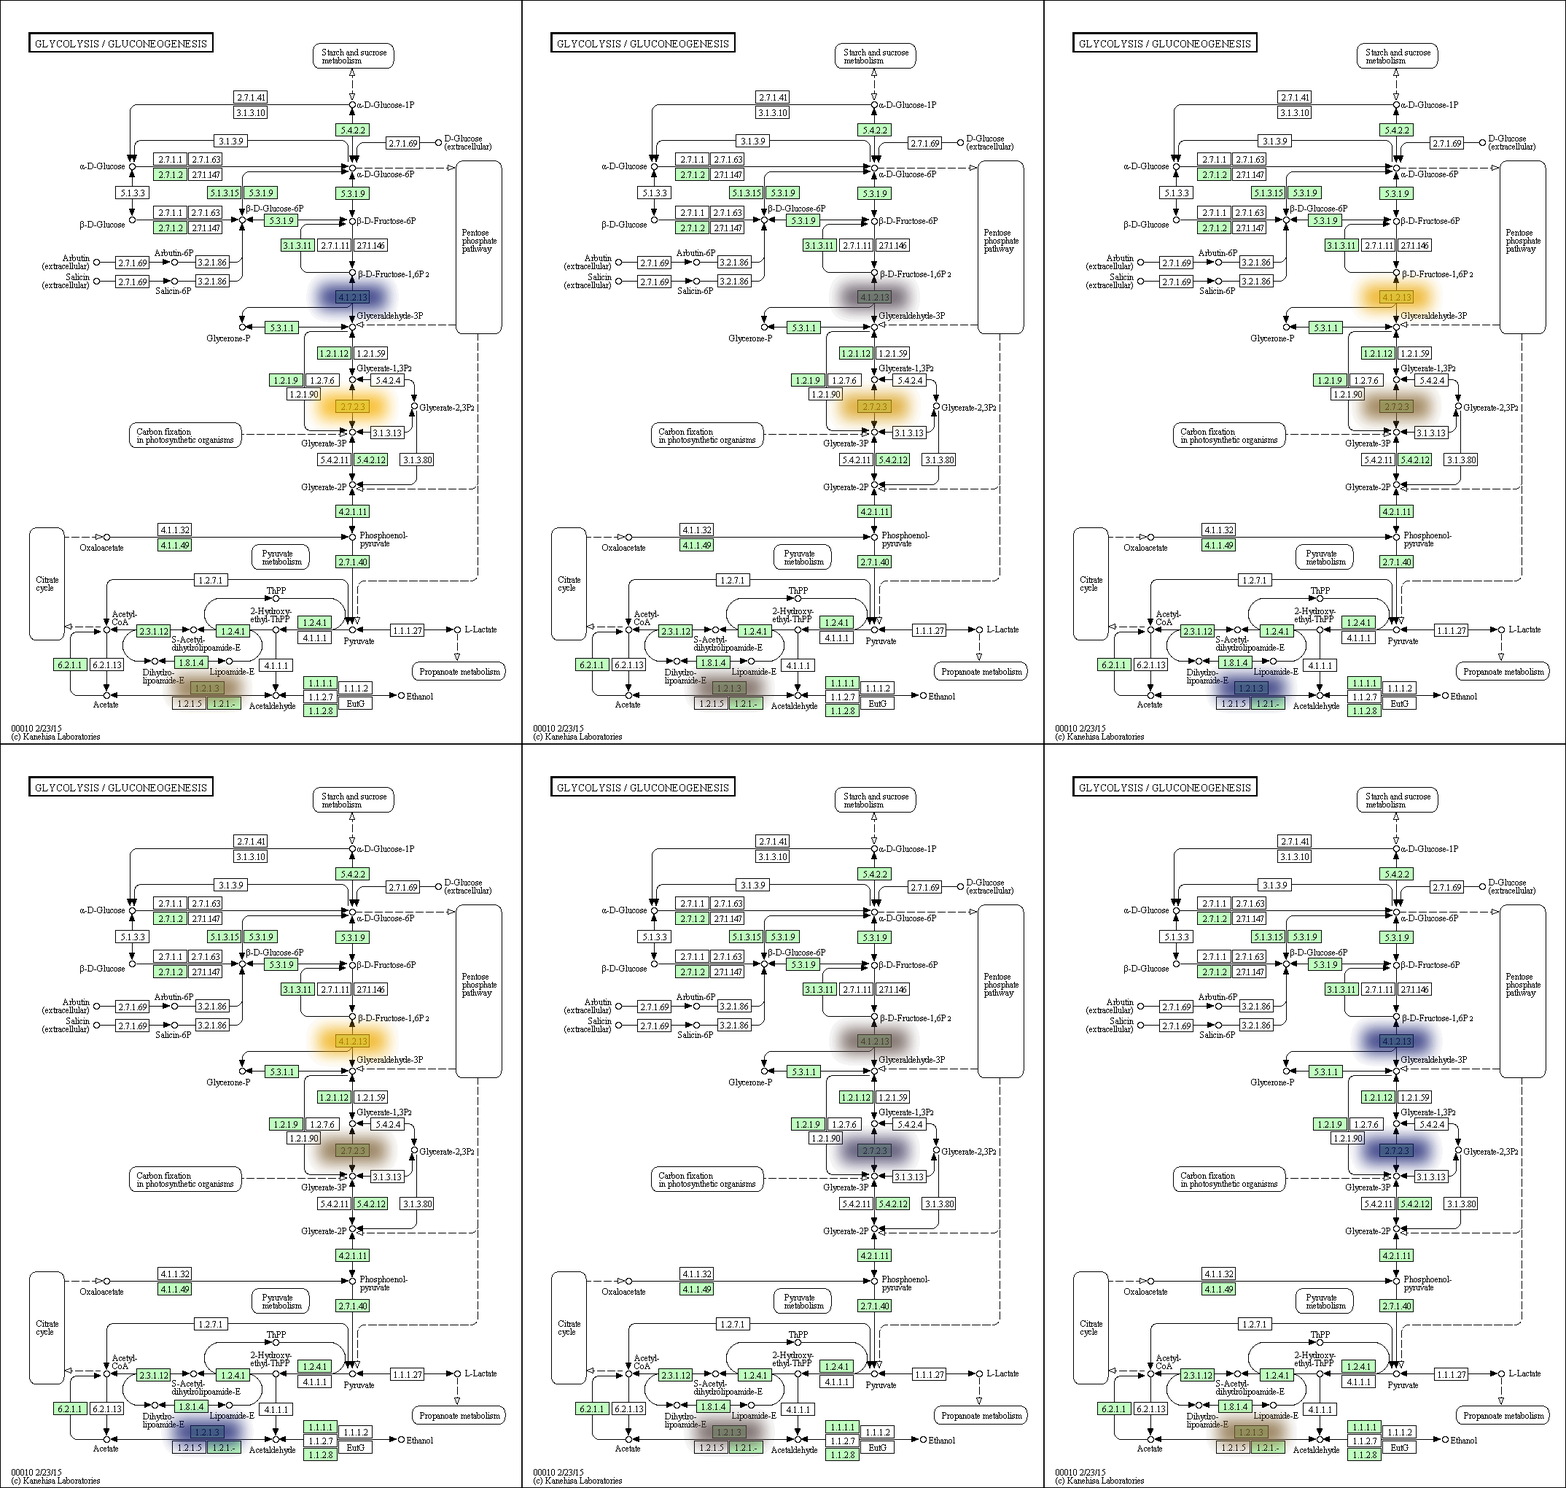
The color, size, and bluring of the overlays can be modified at will. For example, here is the same pathway but with the overlays blurred and scaled up, and using a blue-to-yellow color palette:

Installation
$ pip install https://github.com/ajmazurie/kegg-animate-pathway/zipball/master
Usage
kegg-animate-pathway is used on the command line; options (shown by typing kegg-animate-pathways --help) are available to select a KEGG pathway to display, the genes and/or compounds activity levels to use for the graphic overlay, and various settings for the graphic overlays such as size, blur level, and color. Here is a list of all these options:
usage: kegg-animate-pathway [-h] -p KEGG IDENTIFIER -l FILENAME
                            [--aggregate {mean,median,lowest,highest,random}]
                            [--mid-value VALUE] -o FILENAME
                            [--duration SECONDS] [--fps INTEGER]
                            [--with-labels] [--label-font FONTNAME]
                            [--label-size INTEGER]
                            [--start-color INTEGER INTEGER INTEGER]
                            [--mid-color INTEGER INTEGER INTEGER]
                            [--end-color INTEGER INTEGER INTEGER]
                            [--blur INTEGER] [--transparency INTEGER]
                            [--scale FLOAT] [-v]

optional arguments:
  -h, --help            show this help message and exit
  -v, --verbose         (optional) if set, will display debug information

input options:
  -p KEGG IDENTIFIER, --pathway-id KEGG IDENTIFIER
                        (mandatory) KEGG identifier for a pathway
  -l FILENAME, --levels FILENAME
                        (mandatory) CSV-formatted file with activity levels;
                        this option can be used more than once, one per file

processing options:
  --aggregate {mean,median,lowest,highest,random}
                        (optional) Function used to aggregate activity levels
                        when more than one entity share the same graphic
                        element. Default: median
  --mid-value VALUE     (optional) If set, the color palette used for the
                        overlays will use this mid value for the mid color
                        (see --mid-color)

output options:
  -o FILENAME, --output FILENAME
                        (mandatory) Name for the output movie file
  --duration SECONDS    (optional) Duration of the output movie, in seconds.
                        Default: one seconds per time point
  --fps INTEGER         (optional) Frame rate of the output movie. Default: 25
  --with-labels         (optional) If set, will show gene and compound names
                        on the figure
  --label-font FONTNAME
                        (optional) Set a TrueType font to use for the labels
  --label-size INTEGER  (optional) Set a font size to use for the labels; will
                        be ignored if not font is provided by --label-font.
                        Default: 10
  --start-color INTEGER INTEGER INTEGER
                        (optional) Starting color, as a R/G/B triple of 8-bits
                        integers. Default: (0, 0, 0)
  --mid-color INTEGER INTEGER INTEGER
                        (optional) Middle color, as a R/G/B triple of 8-bits
                        integers; ignored if no middle value was defined (see
                        --mid-value). Default: midpoint between --start-color
                        and --end-color
  --end-color INTEGER INTEGER INTEGER
                        (optional) Ending color, as a R/G/B triple of 8-bits
                        integers. Default: (255, 255, 255)
  --blur INTEGER        (optional) Blur radius for the graphic overlays.
                        Default: 0
  --transparency INTEGER
                        (optional) Transparency level of the graphic overlays,
                        from 0 (opaque) to 255 (invisible). Default: 50
  --scale FLOAT         (optional) Scaling factor of the graphic overlays.
                        Default: 1
Example
$ kegg-animate-pathway --pathway-id pae00010 --levels genes.csv --output pae00010.gif
This command will retrieve information about pathway pae00010 (glycolysis and gluconeogenesis) from KEGG, retrieve information about gene activities from the file genes.csv, and combine both into an animated GIF file pae00010.gif. Default values are selected for the color palette used to show activity levels (from black for the lowest value to white for the highest value), and the graphic overlays.

Example 2
$ kegg-animate-pathway --pathway-id pae00010 --levels genes.csv --output pae00010.gif
Notes
-
The notion of lowest and highest activity level is per dataset only (option
--levels); i.e., distinct datasets will be processed independently with respect to the range of values they have. -
The use of green for down-regulated and green for up-regulated genes and proteins is a de facto standard in the literature. Those colors, however, are difficult to distinguish for most color-blind people. As discussed at http://jfly.iam.u-tokyo.ac.jp/color/ the following replacements are better options: instead of green (0 255 0) and red (255 0 0) you should prefer bluish green (0 158 115) and orange (230 159 0). Even better, you should prefer sky blue (86 180 233) and yellow (240 228 66); those have a higher contrast than the previous choice.
