Sonar Intellij Plugin Save
This SonarQube community plugin is developed to support multiple languages and almost all Jetbrains IDEs. See the README for more details
SonarQube IntelliJ Community Plugin
The main goal of this plugin is to show SonarQube issues directly within your IntelliJ IDE. Currently the plugin is build to work in IntelliJ IDEA, RubyMine, WebStorm, PhpStorm, PyCharm, AppCode and Android Studio with any programming language you can analyze in SonarQube.
Two tasks are covered by the plugin:
- downloading issues of previously analyzed code from a Sonar server and show them in your IDE
- running a script to perform a local analysis to find issues in your local code
We appreciate constructive feedback and contributions of any kind, so please report any issues with the plugin by filing a new issue, get in touch via our Google Groups mailing list or send a pull request whenever you feel things could be done in a better way. We are really grateful for your support.
Usage
Project Configuration
You can install the "SonarQube Community Plugin" via the plugin manager inside your Jetbrains IDE or download it from the Jetbrains Plugin Repository. After the installation, you first of all need to configure the connection to your Sonar server. This is done per project and/ or module. You can use a remote server or a local one on your machine.
In your Windows IDE go to File -> Settings -> Other Settings -> SonarQube.
In your Mac IDE go to Preferences -> Other Settings -> SonarQube.
(PS: different version IDE and operating system may different path)

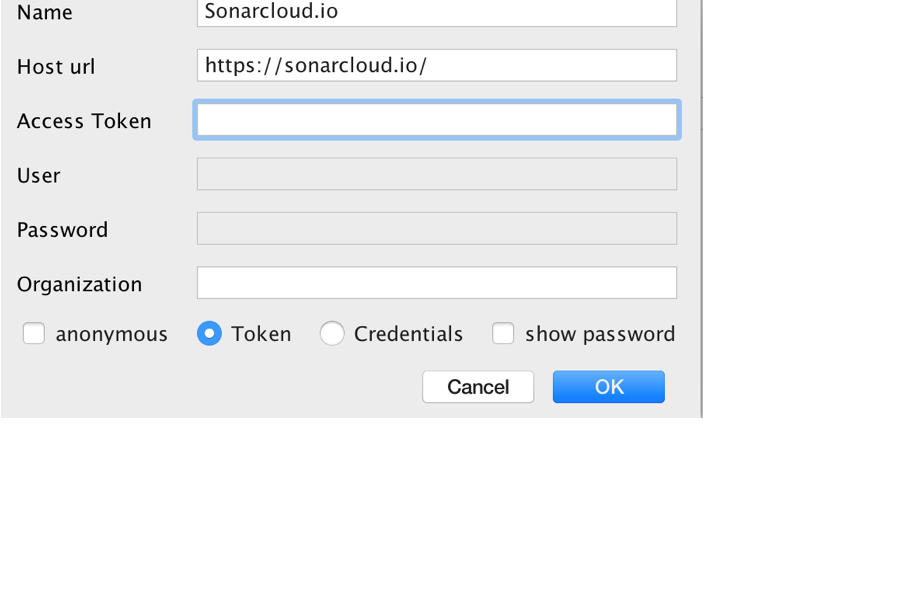
Click Add, enter the address of your Sonar server and the credentials (if needed) and click OK (if you use Sonarcloud.io as Sonar server then you need to enter value for Organization).

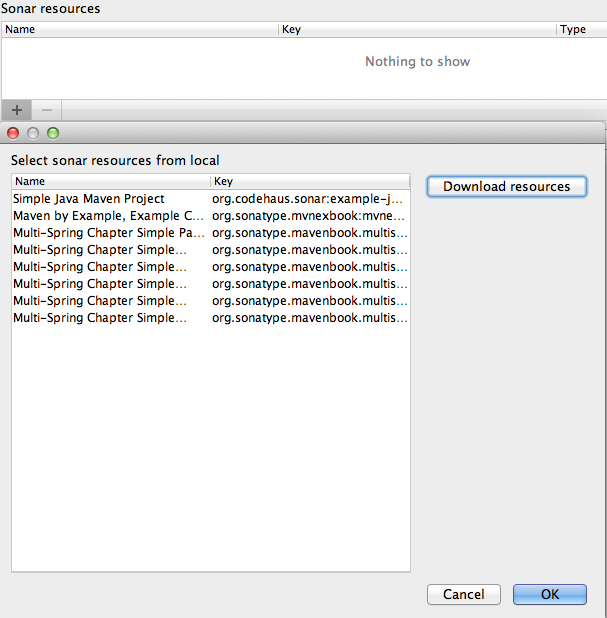
Back on the previous screen, find the Sonar resources section and click the + button to select the Sonar resource for this project:

Your final SonarQube Server configuration should now look like the following:

Code inspection
The plugin provides two inspections:
- SonarQube - shows already analysed issues
- SonarQube (new issues) - shows only new issues from local analysis
To perform a code inspection you can:
Go to Analyze -> Inspect code.
Select whole project. It is recommended that you create a Sonar Inspection profile, with Sonar inspections only, but you can also use the default profile or any other self defined inspection profile.
After the execution the inspection result should look like:

As the Sonar analysis process is prone to errors, it is essential to see what happened during the analysis. You can use the Sonar console for error analysis, especially during initial configuration:

Local analysis configuration
After configuring the Sonar server you are ready to start downloading issues and showing them in the IDEA. But as soon you start editing your source code, you might want to trigger a local sonar analysis.
NOTE Local analysis is NOT available for SonarQube versions 7.9.1 or later. See #231
Develop
Hacking the plugin is very easy, just follow the following steps
Prerequisites
- install IntelliJ (Community Edition is ok)
- install Gradle (http://gradle.org/)
- configure Plugin SDK (https://www.jetbrains.com/idea/help/configuring-intellij-platform-plugin-sdk.html)
Starting
- open a terminal
- clone the repository
-
git clone https://github.com/sonar-intellij-plugin/sonar-intellij-plugin.git
-
- create an IntelliJ project which can be imported to IntelliJ
-
cd sonar-intellij-plugin -
gradle gradle idea
-
- open project in IntelliJ
- File->Open-> (Directory sonar-intellij-plugin)
- run the plugin inside intellij
- run gradleTask runIde
License
The project is licensed under Apache Public License 2.0! See the LICENSE file for details.
Love it!
Via PayPal. Thanks! (-8
